




This guide compares revenue cycle analytics software for physical therapy clinics, arguing that trend-based reporting, tracking whether performance is improving quarter over quarter, matters more than a static monthly snapshot. A comparison table covers SPRY, WebPT, Raintree, and Prompt EMR on trend reporting, multi-location breakdown, live activity data, and query-based access. The page details a two-category KPI framework (staff productivity metrics and revenue/financial metrics) and a widely cited four-metric industry standard for revenue cycle health: clean claim rate, denial rate, DSO, and net collections rate. It also covers how review frequency should differ between live activity data and trend metrics. SPRY's multi-location dashboard is shown reporting revenue, utilization, clean claim rate, denial rate, and A/R cycle as quarter-over-quarter trends, anchored by an independently reported case study: First Rehabilitation, covered by Healthcare IT News, grew revenue 37% and increased monthly reimbursements from $2,680 to $102,000 after connecting its billing and analytics into one platform.
What Is the Best Revenue Cycle Analytics Software for Physical Therapy?
For most outpatient PT practices, revenue cycle analytics works best as a connected part of the billing platform rather than a separate reporting tool bolted on afterwards, since a report is only useful if it reflects the same data as the claims and payments actually moving through the clinic. SPRY reports revenue, denial rate, provider utilization, and A/R cycle as live, quarter-over-quarter trends rather than static monthly snapshots, with real-time dashboards covering collections, denial rates, CPT mix, payer mix, and provider productivity. Most PT billing dashboards show where a clinic stands today; fewer show whether that position is actually improving.
Why a Snapshot Isn't the Same as an Analytics Platform?
A lot of software marketed as "billing reporting" is really just a static export: last month's collections, this month's denial count, a PDF a manager reads once and files away. That answers where we are, but not whether we're getting better, which is the question that actually drives a decision.
The distinction matters for a specific reason: a denial rate of 3% means something different if it was 5% last quarter than if it was 2%. A revenue number means something different with the trend line attached. Analytics that show direction, not just position, are what let an owner or multi-location director act before a problem compounds rather than after.
What Revenue Cycle KPIs Should a PT Clinic Actually Track?
Most clinics track one or two numbers, usually total collections and maybe A/R days, and stop there. A complete picture needs two separate categories of metrics, tracked together, since a clinic can look financially healthy on paper while a specific therapist, payer, or CPT code quietly drags performance down.
The two categories matter for a specific reason: revenue metrics tell you what happened financially, but staff productivity metrics tell you why. A denial rate by therapist, for instance, can point to a documentation habit or coding pattern that a clinic-wide denial number would completely hide.
How SPRY Approaches Revenue Cycle Analytics?
SPRY's Business Intelligence and Reporting & Analytics layer is built directly on the same data as RCM & Billing, rather than as a separate reporting export, so what shows up on a dashboard reflects the same claims, denials, and payments moving through the clinic in real time.
For multi-location groups specifically, SPRY's multi-location clinics dashboard reports performance as a live trend, not a static number:
This same connected model shows up in SPRY's live billing and payments workflow, referenced on the Grow Revenue page, where teams see activity as it happens rather than after a billing cycle closes: how many ERA files posted today, how many payment links were sent this week, and what patient balances are currently open, alongside claim-level detail like clean claim rate and issues resolved before submission.
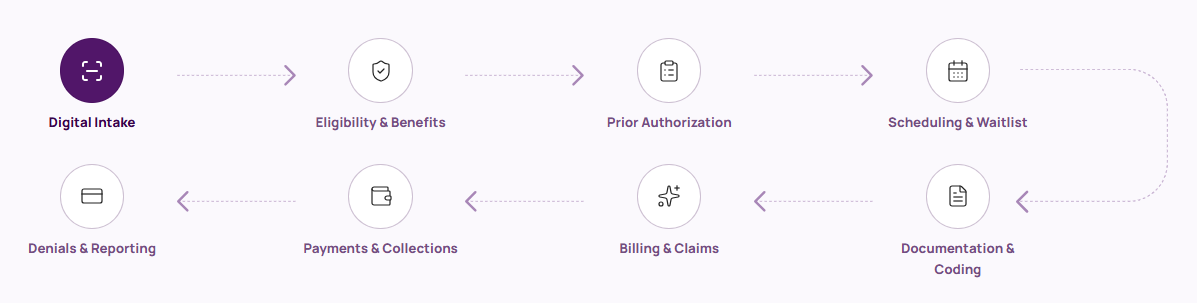
For teams who want a direct answer rather than navigating a fixed report layout, SPRY's business intelligence tools support conversational data queries, letting staff ask a direct question about performance instead of hunting through a preset dashboard structure.
SPRY vs WebPT vs Raintree vs Prompt: Revenue Cycle Analytics Compared
Disclaimer: Based on each vendor's publicly available materials as of writing. Verify current capabilities directly with each vendor before purchase. Rows marked "not publicly documented" reflect an absence of public information, not a confirmed absence of the capability.
What Four Metrics Do Industry Experts Say Actually Reveal Revenue Cycle Health?
Rather than tracking every available number, most revenue cycle consultants converge on a small set of metrics that reveal the health of the whole system. One widely cited framework, published by a revenue cycle consultant with over a decade of RCM experience, narrows it to four:
- First-pass clean claim rate — the percentage of claims accepted and paid without correction on the first submission
- Denial rate — the percentage of claims rejected by a payer
- Days Sales Outstanding (DSO), also called A/R days — how long it takes to collect after a claim is submitted
- Net collections rate — the percentage of allowed revenue actually collected, after contractual write-offs
Source: industry revenue cycle consulting framework, see references
The logic behind narrowing to four: when one of these starts drifting, it usually points to a specific breakdown in the workflow rather than a vague, hard-to-locate problem. A dropping clean claim rate points upstream, to documentation or eligibility. A rising DSO points to a submission or follow-up bottleneck. Tracking all four together, rather than any single one in isolation, is what actually reveals where in the revenue cycle a problem is occurring.
How Often Should a PT Clinic Review Revenue Cycle Analytics?
There's no single universal answer, but the more useful framing is by metric type rather than a fixed calendar. Live activity data, same-day claims submitted, ERA files posted, and open balances are meant to be checked daily or even in real time, since it reflects what's happening right now. Trend metrics like quarter-over-quarter revenue growth or denial rate direction are meant to be reviewed monthly or quarterly, since day-to-day noise can obscure the actual trend if checked too frequently. Reviewing only annually, which is common in smaller practices without dedicated billing staff, means a systemic problem can run for months before anyone notices it in the numbers.
What to Look for in Revenue Cycle Analytics Software?
Does it show trends, not just a snapshot?
A single month's denial rate or A/R number tells you where you are. A quarter-over-quarter delta tells you whether your current approach is working.
Does it break performance down by location, payer, and provider, not just clinic-wide?
A blended average across multiple locations or providers can hide exactly which site or which payer is actually the problem.
Does it connect to live activity, not just closed-period summaries?
Knowing how many ERA files posted today, how many payment links are outstanding this week, and what's still open right now is a different kind of visibility than a monthly report generated after the fact.
Can staff ask a direct question and get an answer, rather than hunting through a fixed report layout?
A dashboard with a fixed set of charts only answers the questions its designer anticipated. A conversational or query-based layer answers the question you actually have today.
Does the analytics reflect the same data as billing and documentation, or a separate export?
Analytics pulled from a disconnected export can drift out of sync with what's actually happening in claims and collections. Analytics built on the same live data as billing don't have that lag.
Real Proof: First Rehabilitation
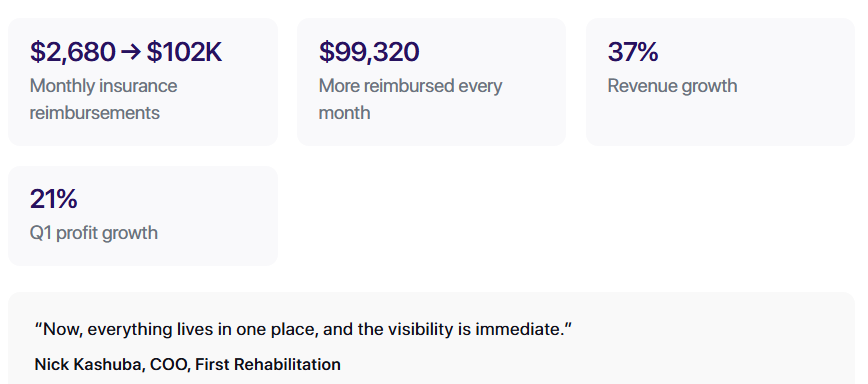
The clearest independent evidence of what connected revenue cycle analytics does for a clinic's actual performance comes from First Rehabilitation, a three-location outpatient rehab group in Palm Beach County, Florida. The clinic's move to SPRY was covered independently by Bill Siwicki, senior editor at Healthcare IT News, which reported:
- Revenue up 37%, with Q1 profit up 21% year over year
- Monthly insurance reimbursements climbed from $2,680 to $102,000
- Evaluation note time dropped from 30 to 40 minutes down to 5 minutes
- Cancellation rate fell from 17% to 7.5%
Frequently Asked Questions
What is revenue cycle analytics software?
Software that tracks and reports on the financial performance of a clinic's billing operation, typically covering collections, denial rates, A/R days, payer mix, and provider productivity, ideally as a live trend rather than a single static report.
How is revenue cycle analytics different from a billing dashboard?
A basic billing dashboard often shows current claim status. Revenue cycle analytics goes further, tracking performance over time, by location, by payer, or by provider, so a clinic can see whether its billing operation is actually improving, not just where it stands today.
What metrics should a PT clinic track for revenue cycle performance?
At minimum: clean claim rate, denial rate, A/R days (also called DSO), net collections rate, and revenue growth, ideally trended quarter over quarter rather than viewed as a single snapshot. A deeper view also tracks staff-level productivity metrics like denial rate by therapist and performance by CPT code.
What is DSO in a healthcare revenue cycle?
DSO stands for Days Sales Outstanding, also referred to as A/R days in a clinical setting. It measures how long it takes, on average, to collect payment after a claim is submitted. A lower DSO means cash is moving through the revenue cycle faster.
How is net collection rate different from gross collection rate?
Gross collection rate compares what was collected to total charges billed. Net collection rate compares what was collected to what was actually allowed after contractual write-offs, which is the more accurate measure of whether a clinic is collecting everything it's actually owed.
Does revenue cycle analytics software replace a billing manager?
No. It gives a billing manager or clinic owner the visibility to know where to focus, rather than requiring them to manually pull and compare reports across systems.
Why does trend data matter more than a single snapshot?
Because a single number lacks context. A 3% denial rate means something very different if it was 5% last quarter than if it was 2%, and only trend data shows which direction a clinic is actually moving.
How often should revenue cycle analytics be reviewed?
Live activity data (claims submitted today, ERA files posted, open balances) is best checked daily. Trend metrics like denial rate or revenue growth direction are best reviewed monthly or quarterly, since daily noise can obscure the real trend.
Ready to See Your Revenue Trend, Not Just This Month's Number?
If your current reporting only tells you where you stand today, not whether you're actually improving, SPRY's team can walk through what connected revenue cycle analytics would look like for your clinic. See current pricing or book a demo.
References
- SPRY Business Intelligence. sprypt.com/business-intelligence
- SPRY Reporting & Analytics. sprypt.com/reporting-analytics
- SPRY, Understanding Analytics in PT Practice Management. sprypt.com/blog/understanding-analytics-in-pt-practice-management
- SPRY Multi-Location Clinics. sprypt.com/organization/multi-location-clinics
- SPRY Grow Revenue. sprypt.com/grow-revenue
- SPRY RCM & Billing. sprypt.com/rcm-billingC
- First Rehabilitation news coverage. sprypt.com/news/first-rehabilitation-grows-revenue
- Healthcare IT News, "First Rehabilitation boosts revenue 37% with outpatient platform," Bill Siwicki. healthcareitnews.com
- Industry revenue cycle health framework (first-pass clean claim rate, denial rate, DSO, net collections rate), revenue cycle consulting publication
Reduce costs and improve your reimbursement rate with a modern, all-in-one clinic management software.
Get a DemoLegal Disclosure:- Comparative information presented reflects our records as of Nov 2025. Product features, pricing, and availability for both our products and competitors' offerings may change over time. Statements about competitors are based on publicly available information, market research, and customer feedback; supporting documentation and sources are available upon request. Performance metrics and customer outcomes represent reported experiences that may vary based on facility configuration, existing workflows, staff adoption, and payer mix. We recommend conducting your own due diligence and verifying current features, pricing, and capabilities directly with each vendor when making software evaluation decisions. This content is for informational purposes only and does not constitute legal, financial, or business advice.